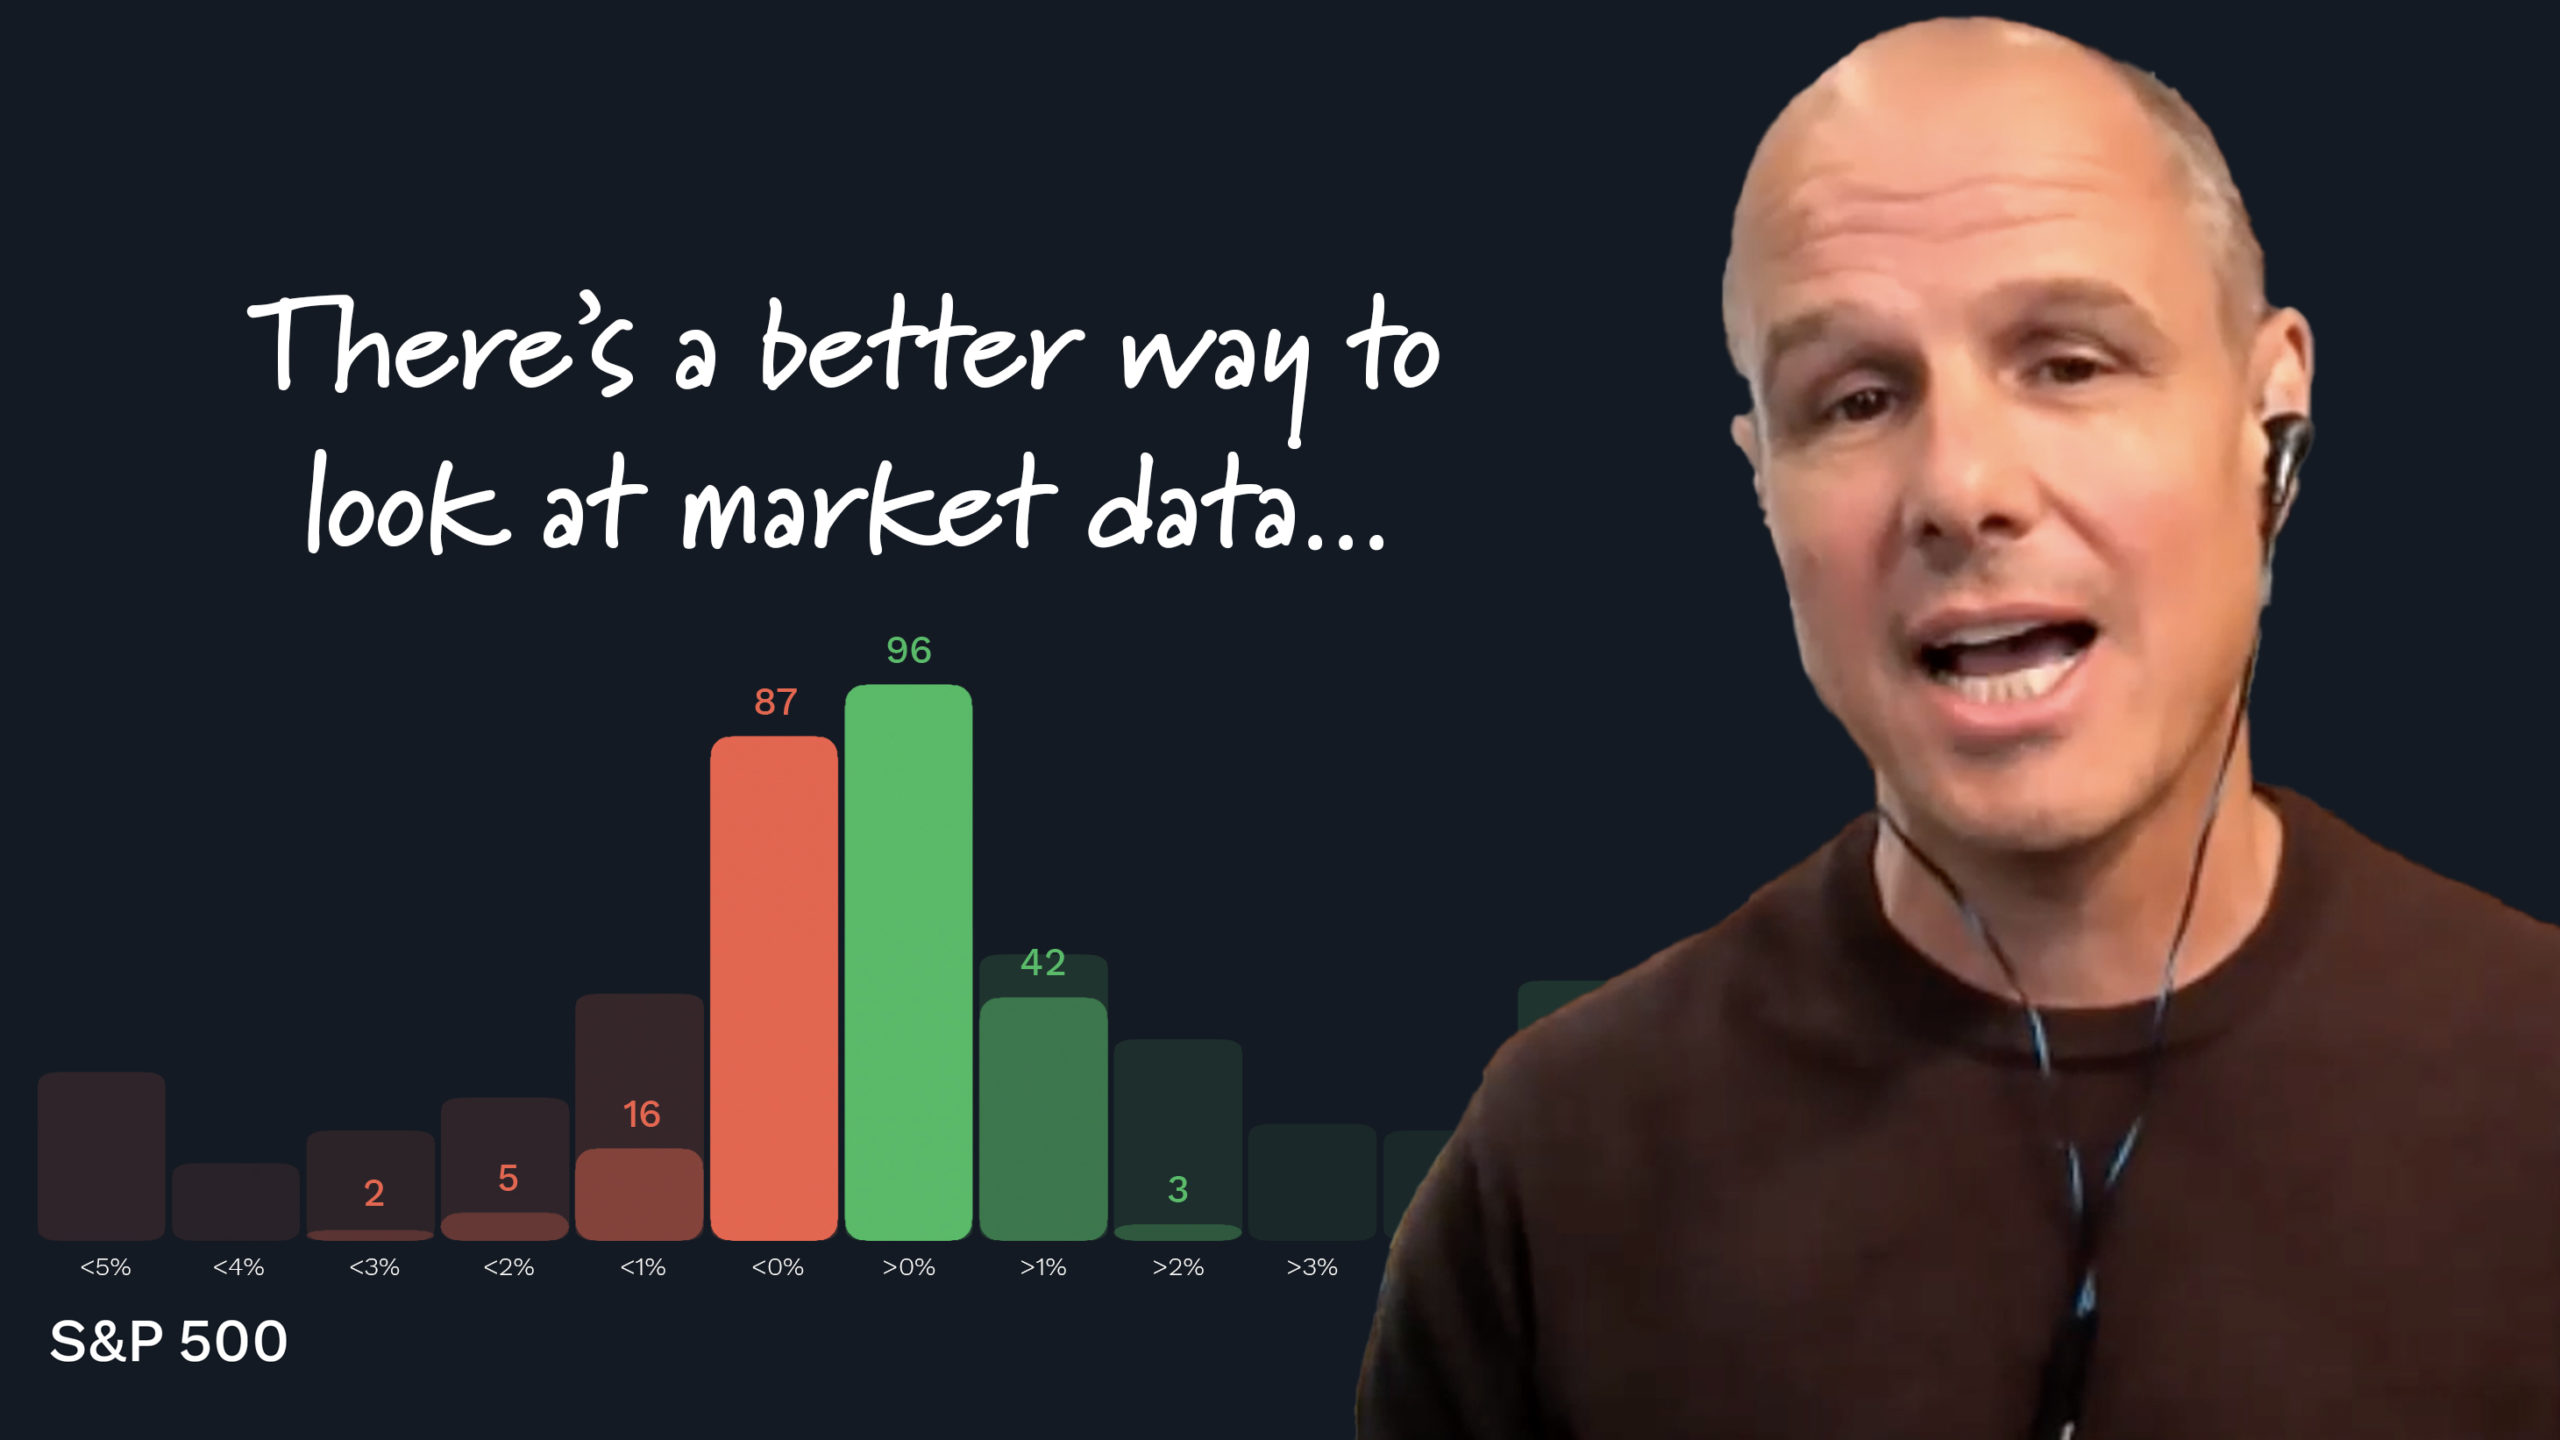
If you watch Dr. Smith’s Q&As and read The RISK Rituals, you’ll start to understand risk as a shape. That shape will appear in a histogram (a bar graph that measures frequency).
Some of you may be having painful flashbacks to high school math. But don’t worry, the math has already been done. You’ll be looking at the results and how they can make you a more successful investor.
If you haven’t had a chance to read last week’s issue of The RISK Rituals, The Shape of Risk, we highly recommend it. Today’s Q&A reinforces the ideas in that issue as Dr. Smith talks more about histograms.
Specifically, you’ll hear about how important it is to look at how a stock’s price has changed instead of what the actual price was over the course of a year.